Sometimes, the total memory usage show up in the “Memory” tab is not the same with the sum-up value in “Processes” tab. Concretely:
- The total memory usage is high when check out the “Performance – Memory” tab
- When looking into “Process” tab, memory usage of all processes sums up to a much smaller value then previous “total usage”
This post provided an approach to check the actual memory usage of running processes and thus to locate a memory leak of a certain program.
Which Process Used the Memory
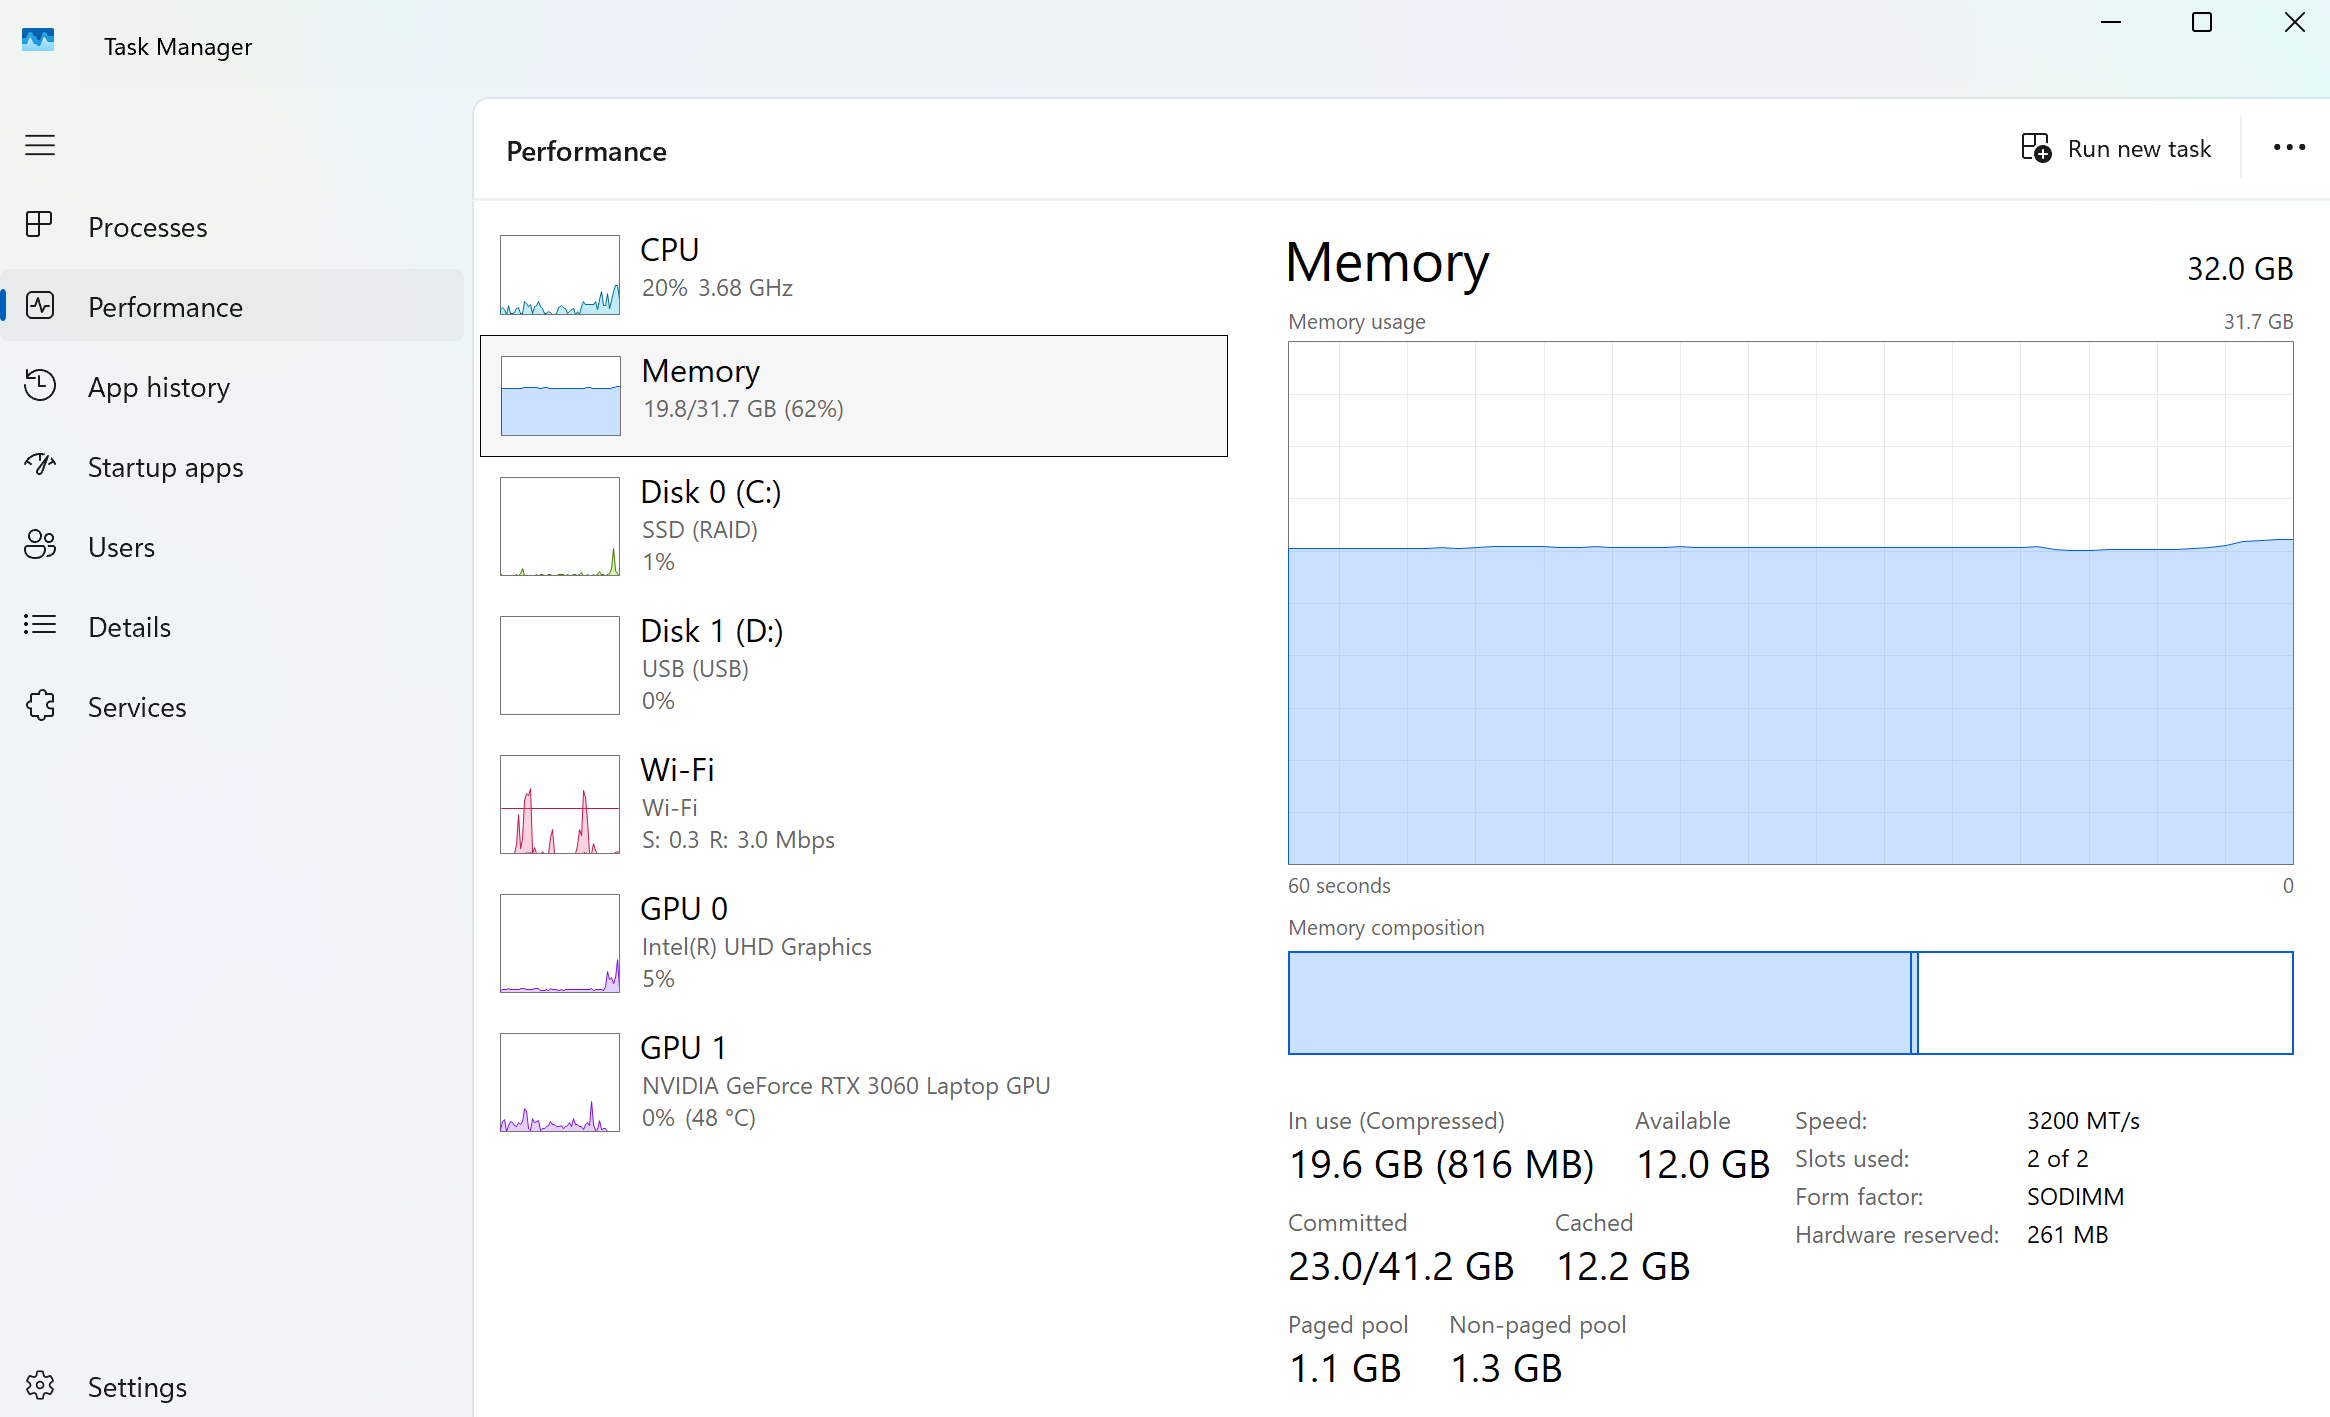
We could see from image above the Task Manager indicates 19.6GB memory used, however, when we checkout the “Processes” tab:
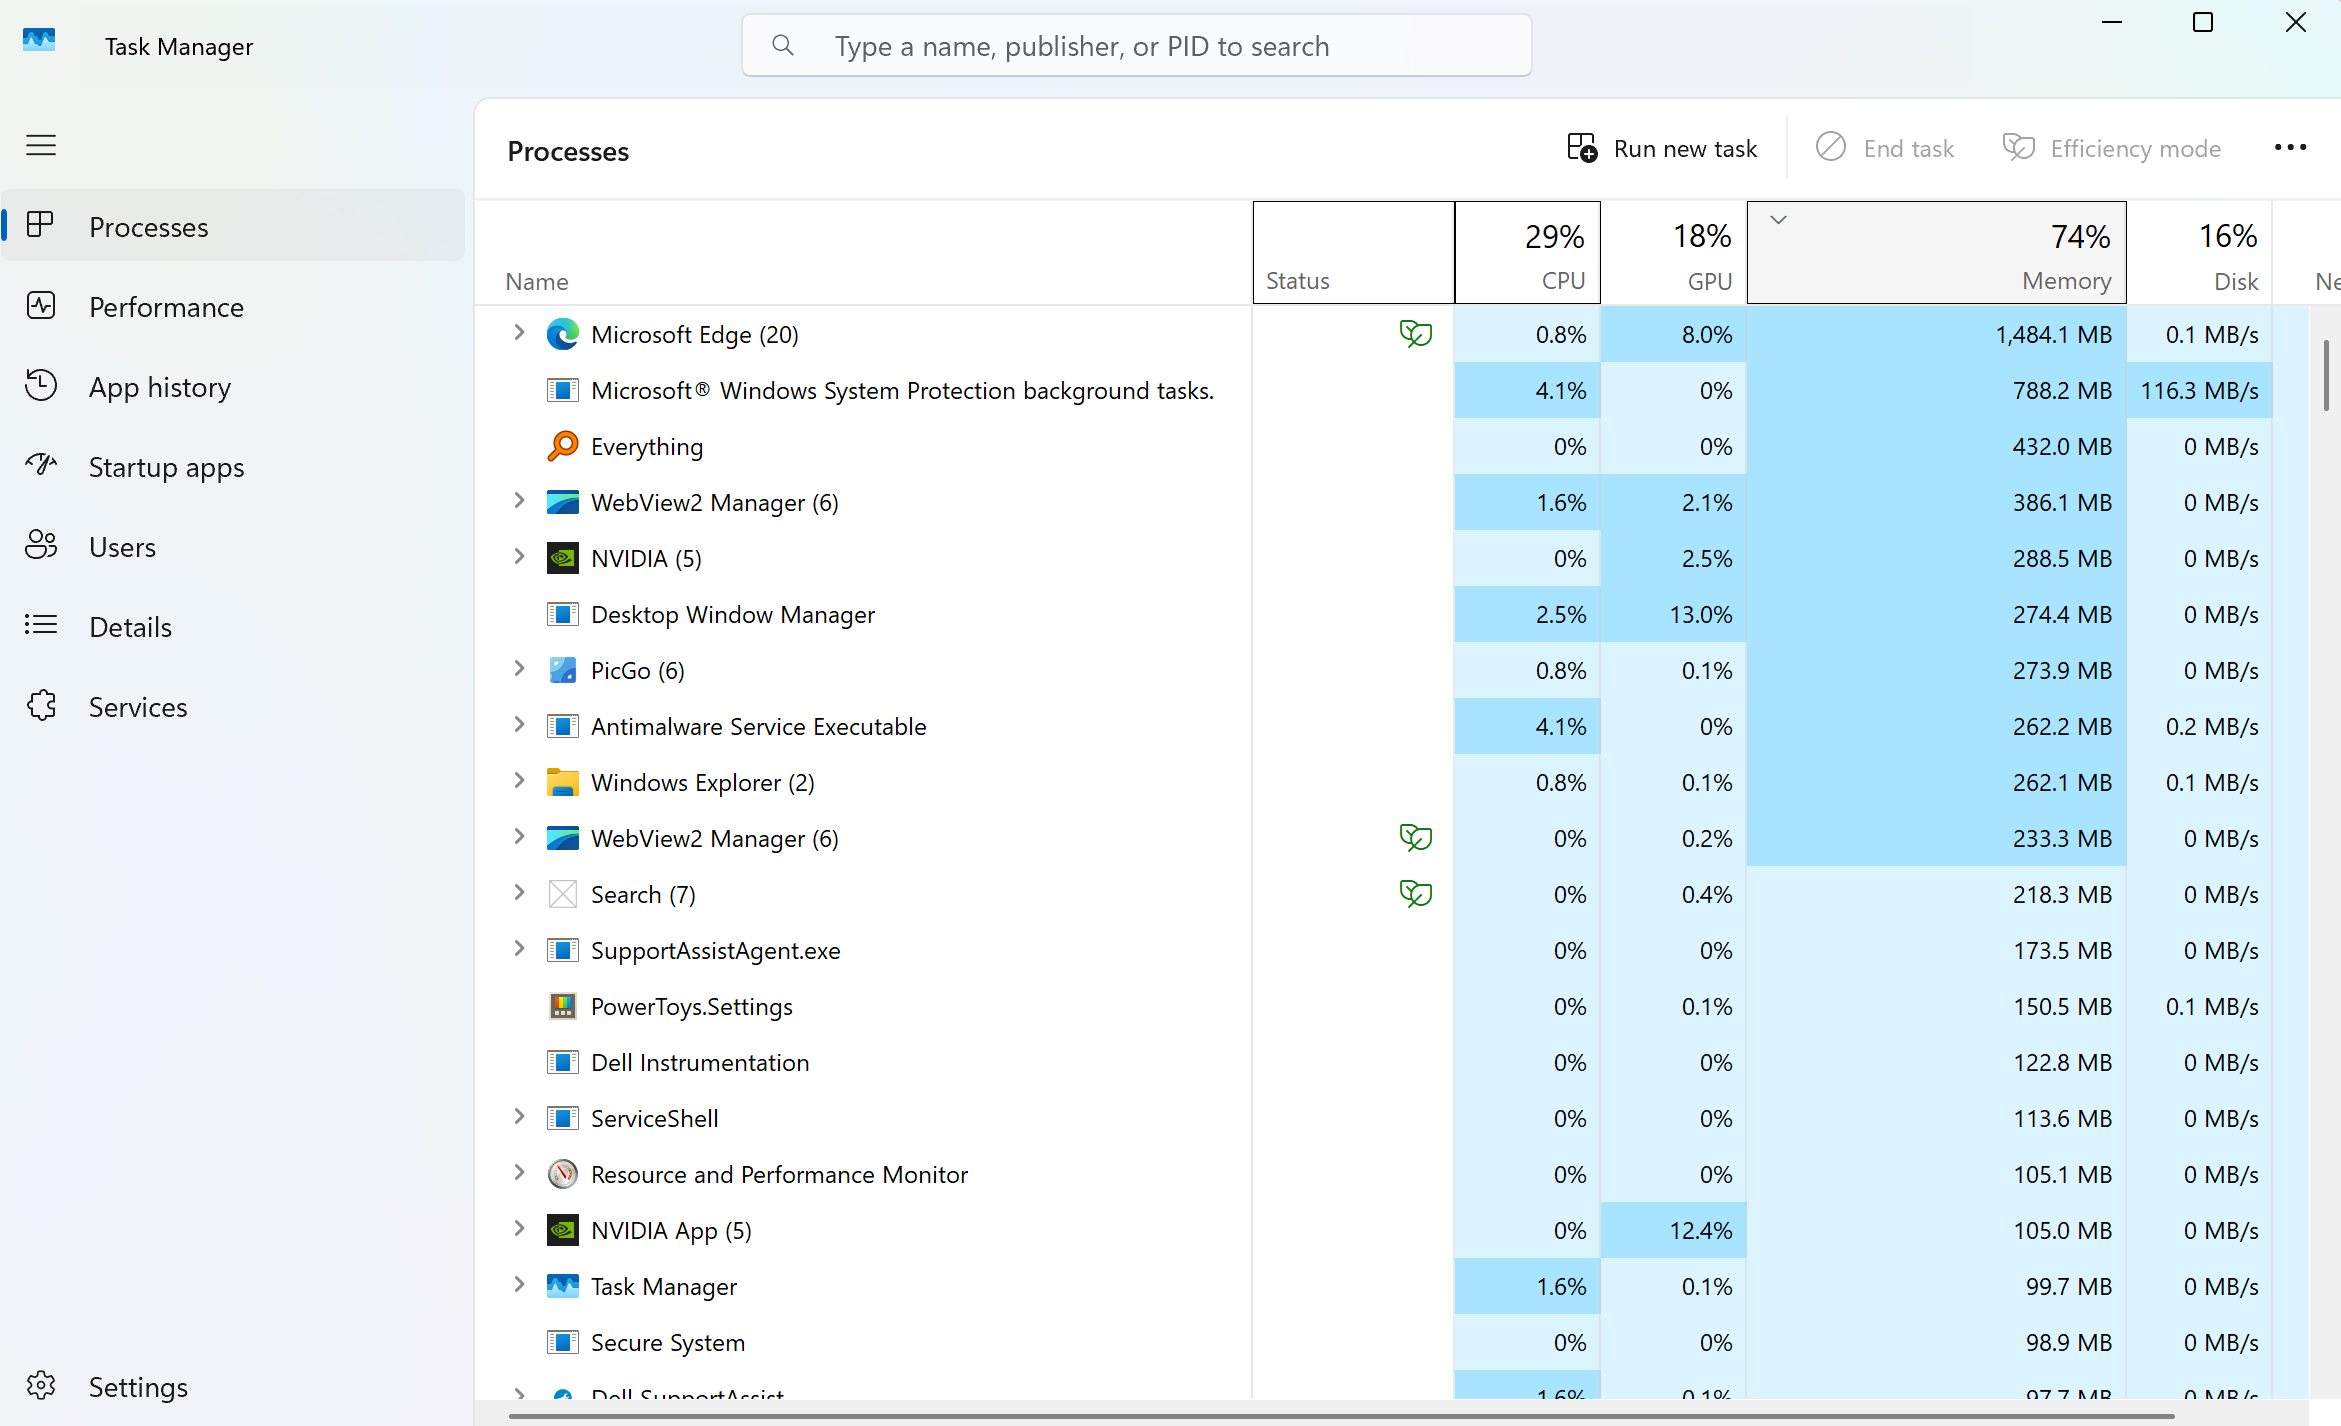
We will find out that the memory usage sums up to a smaller value then the total number in “Memory” tab.
In this case, we could use Resource Manager to check the actual memory usage:
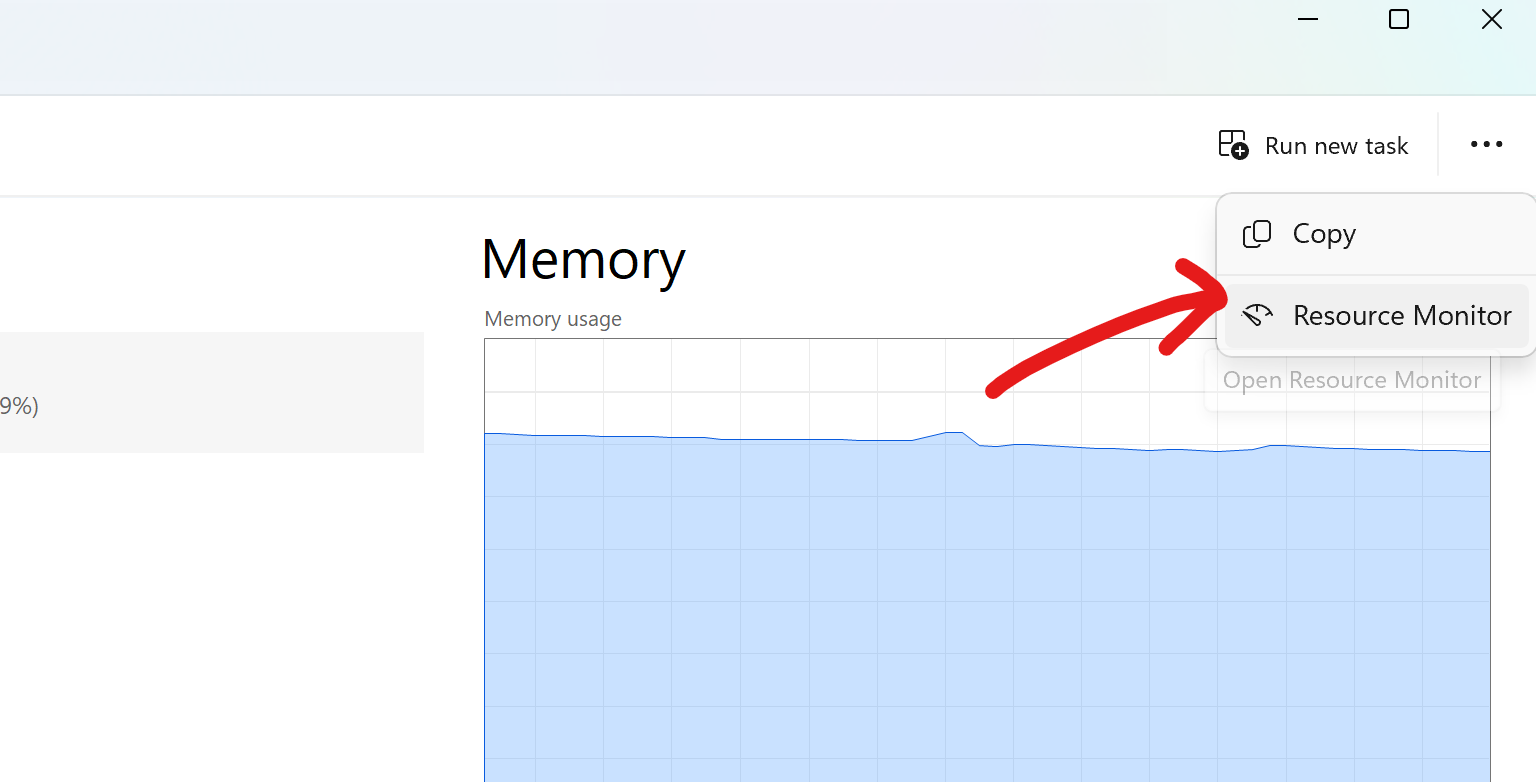
Open the Resource Manager based on image above, then check the memory working set usage as image shows below:
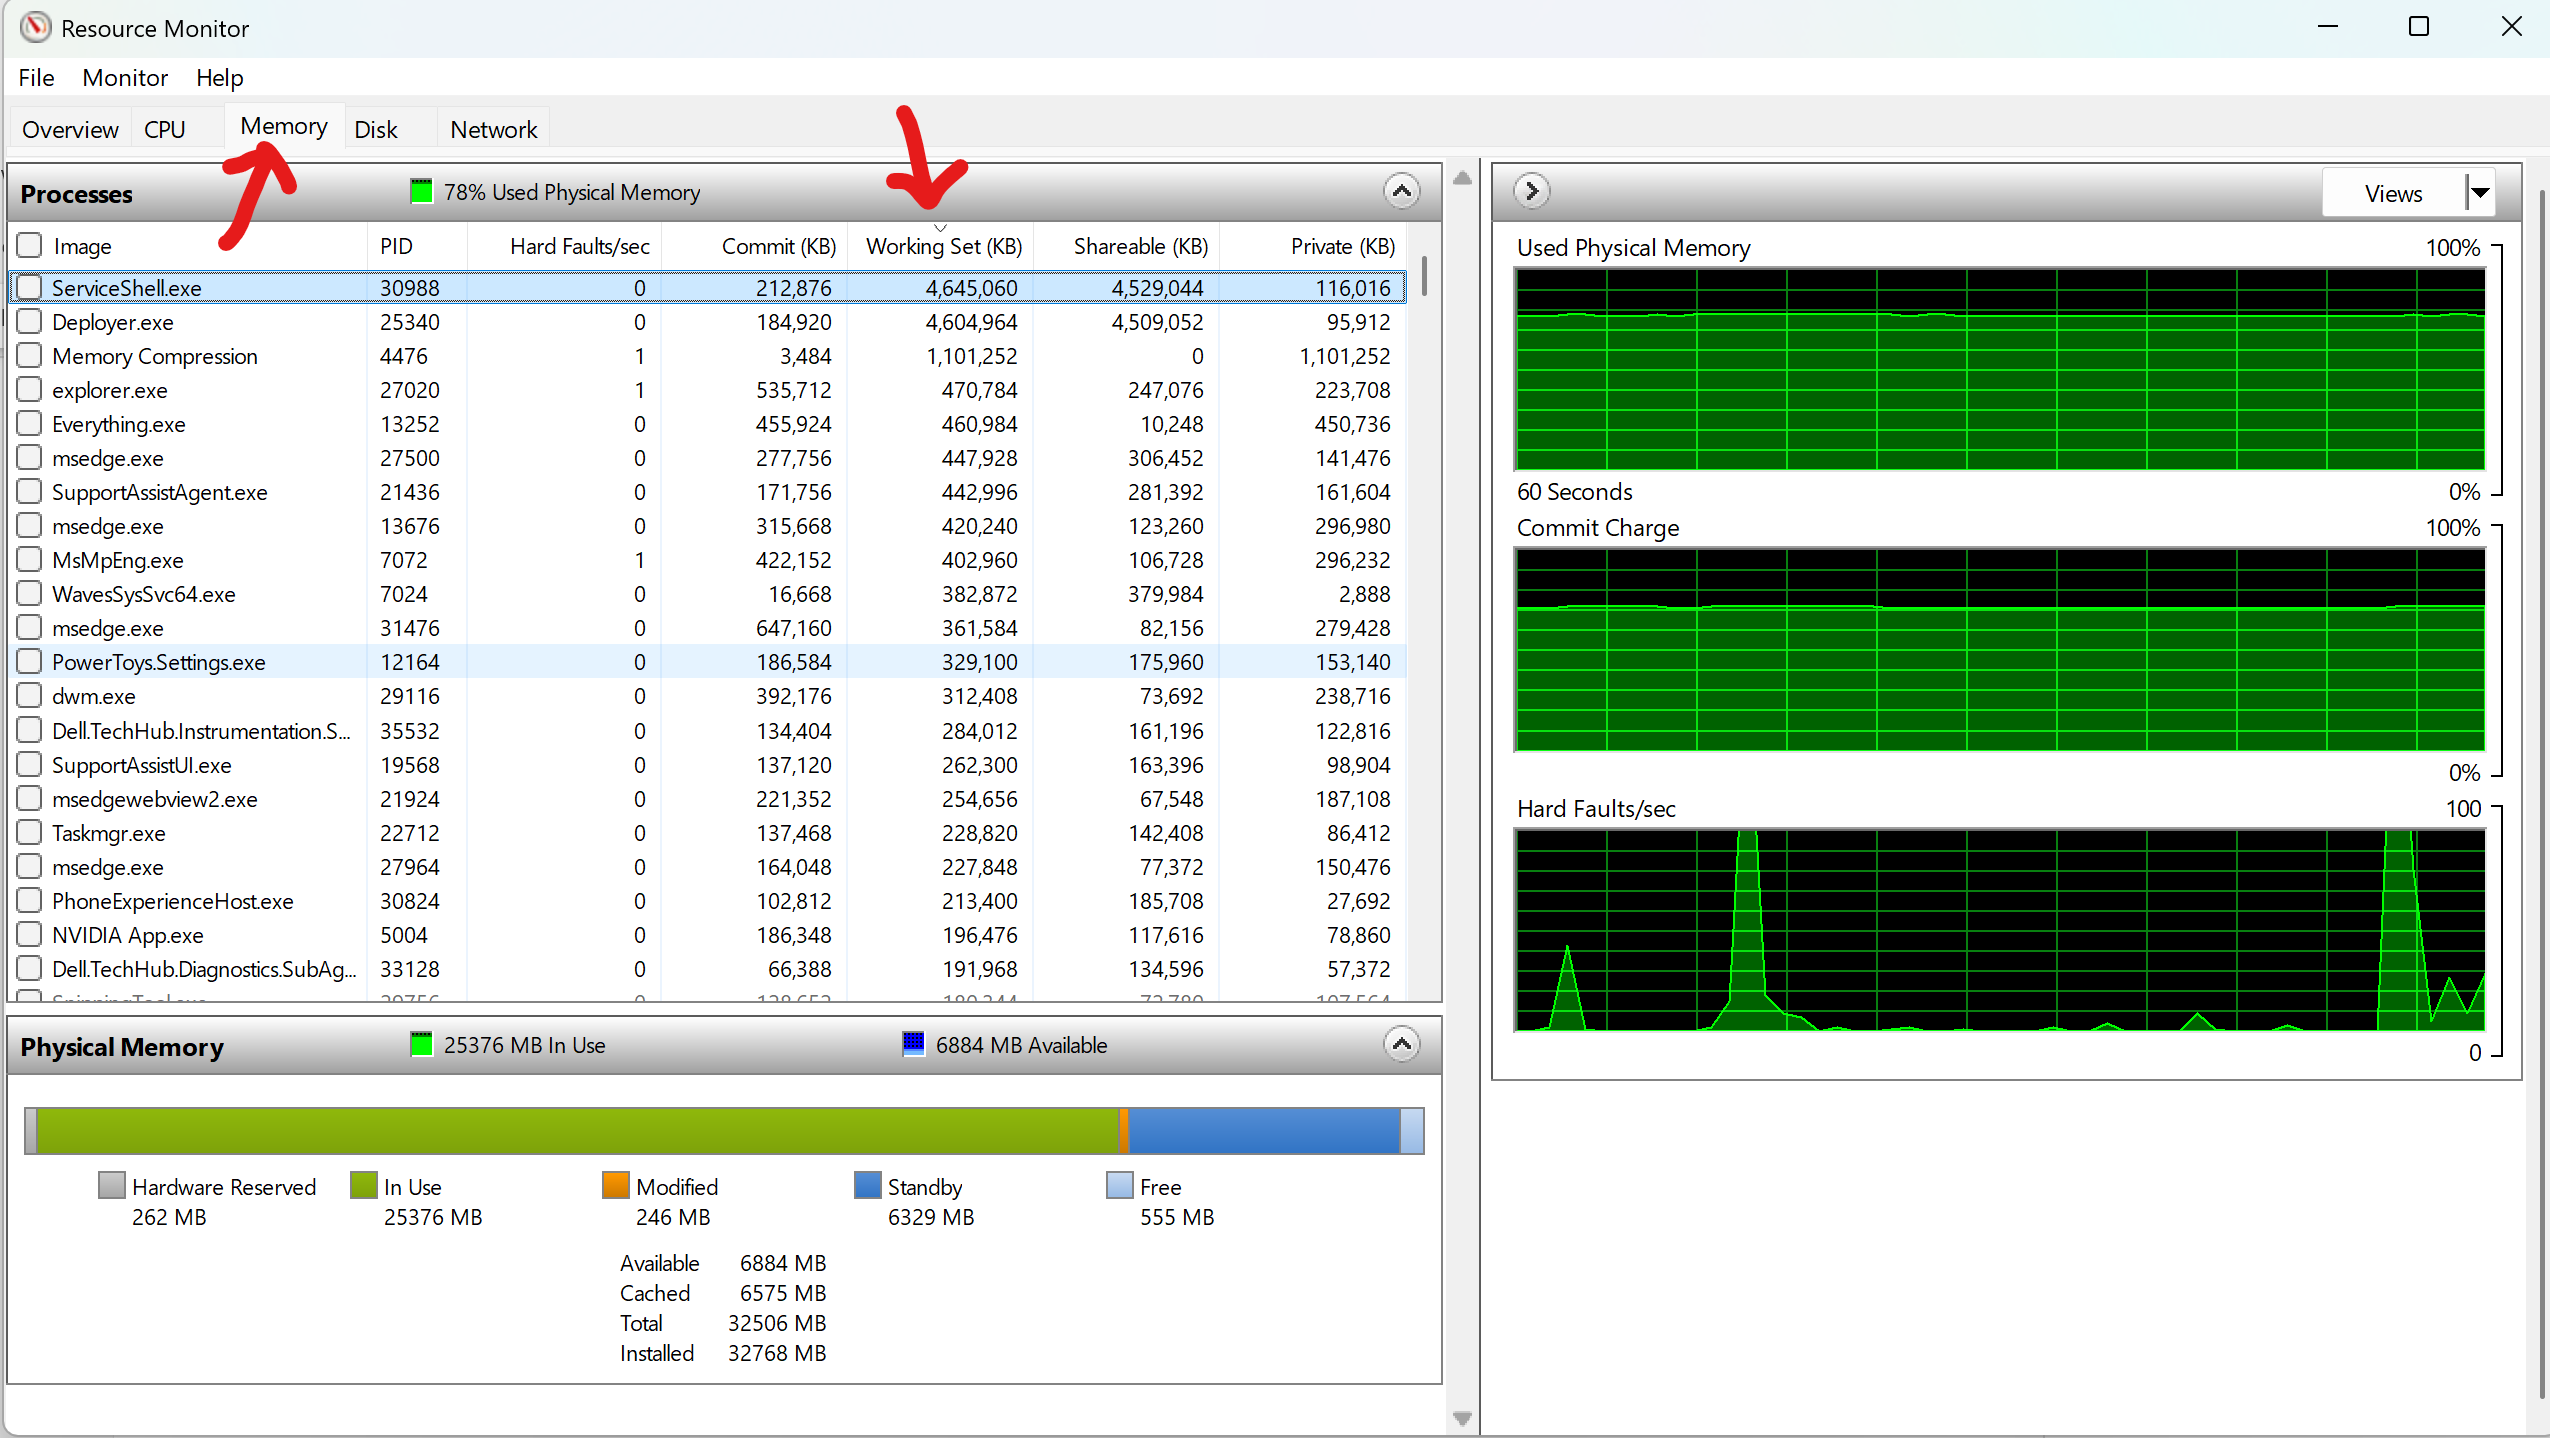
We could see that ServiceShell.exe and Deployer.exe have a super large memory working set.
Detailed Info of the Process
After knowing the name of the process, we could go back to search it in Task Manager:
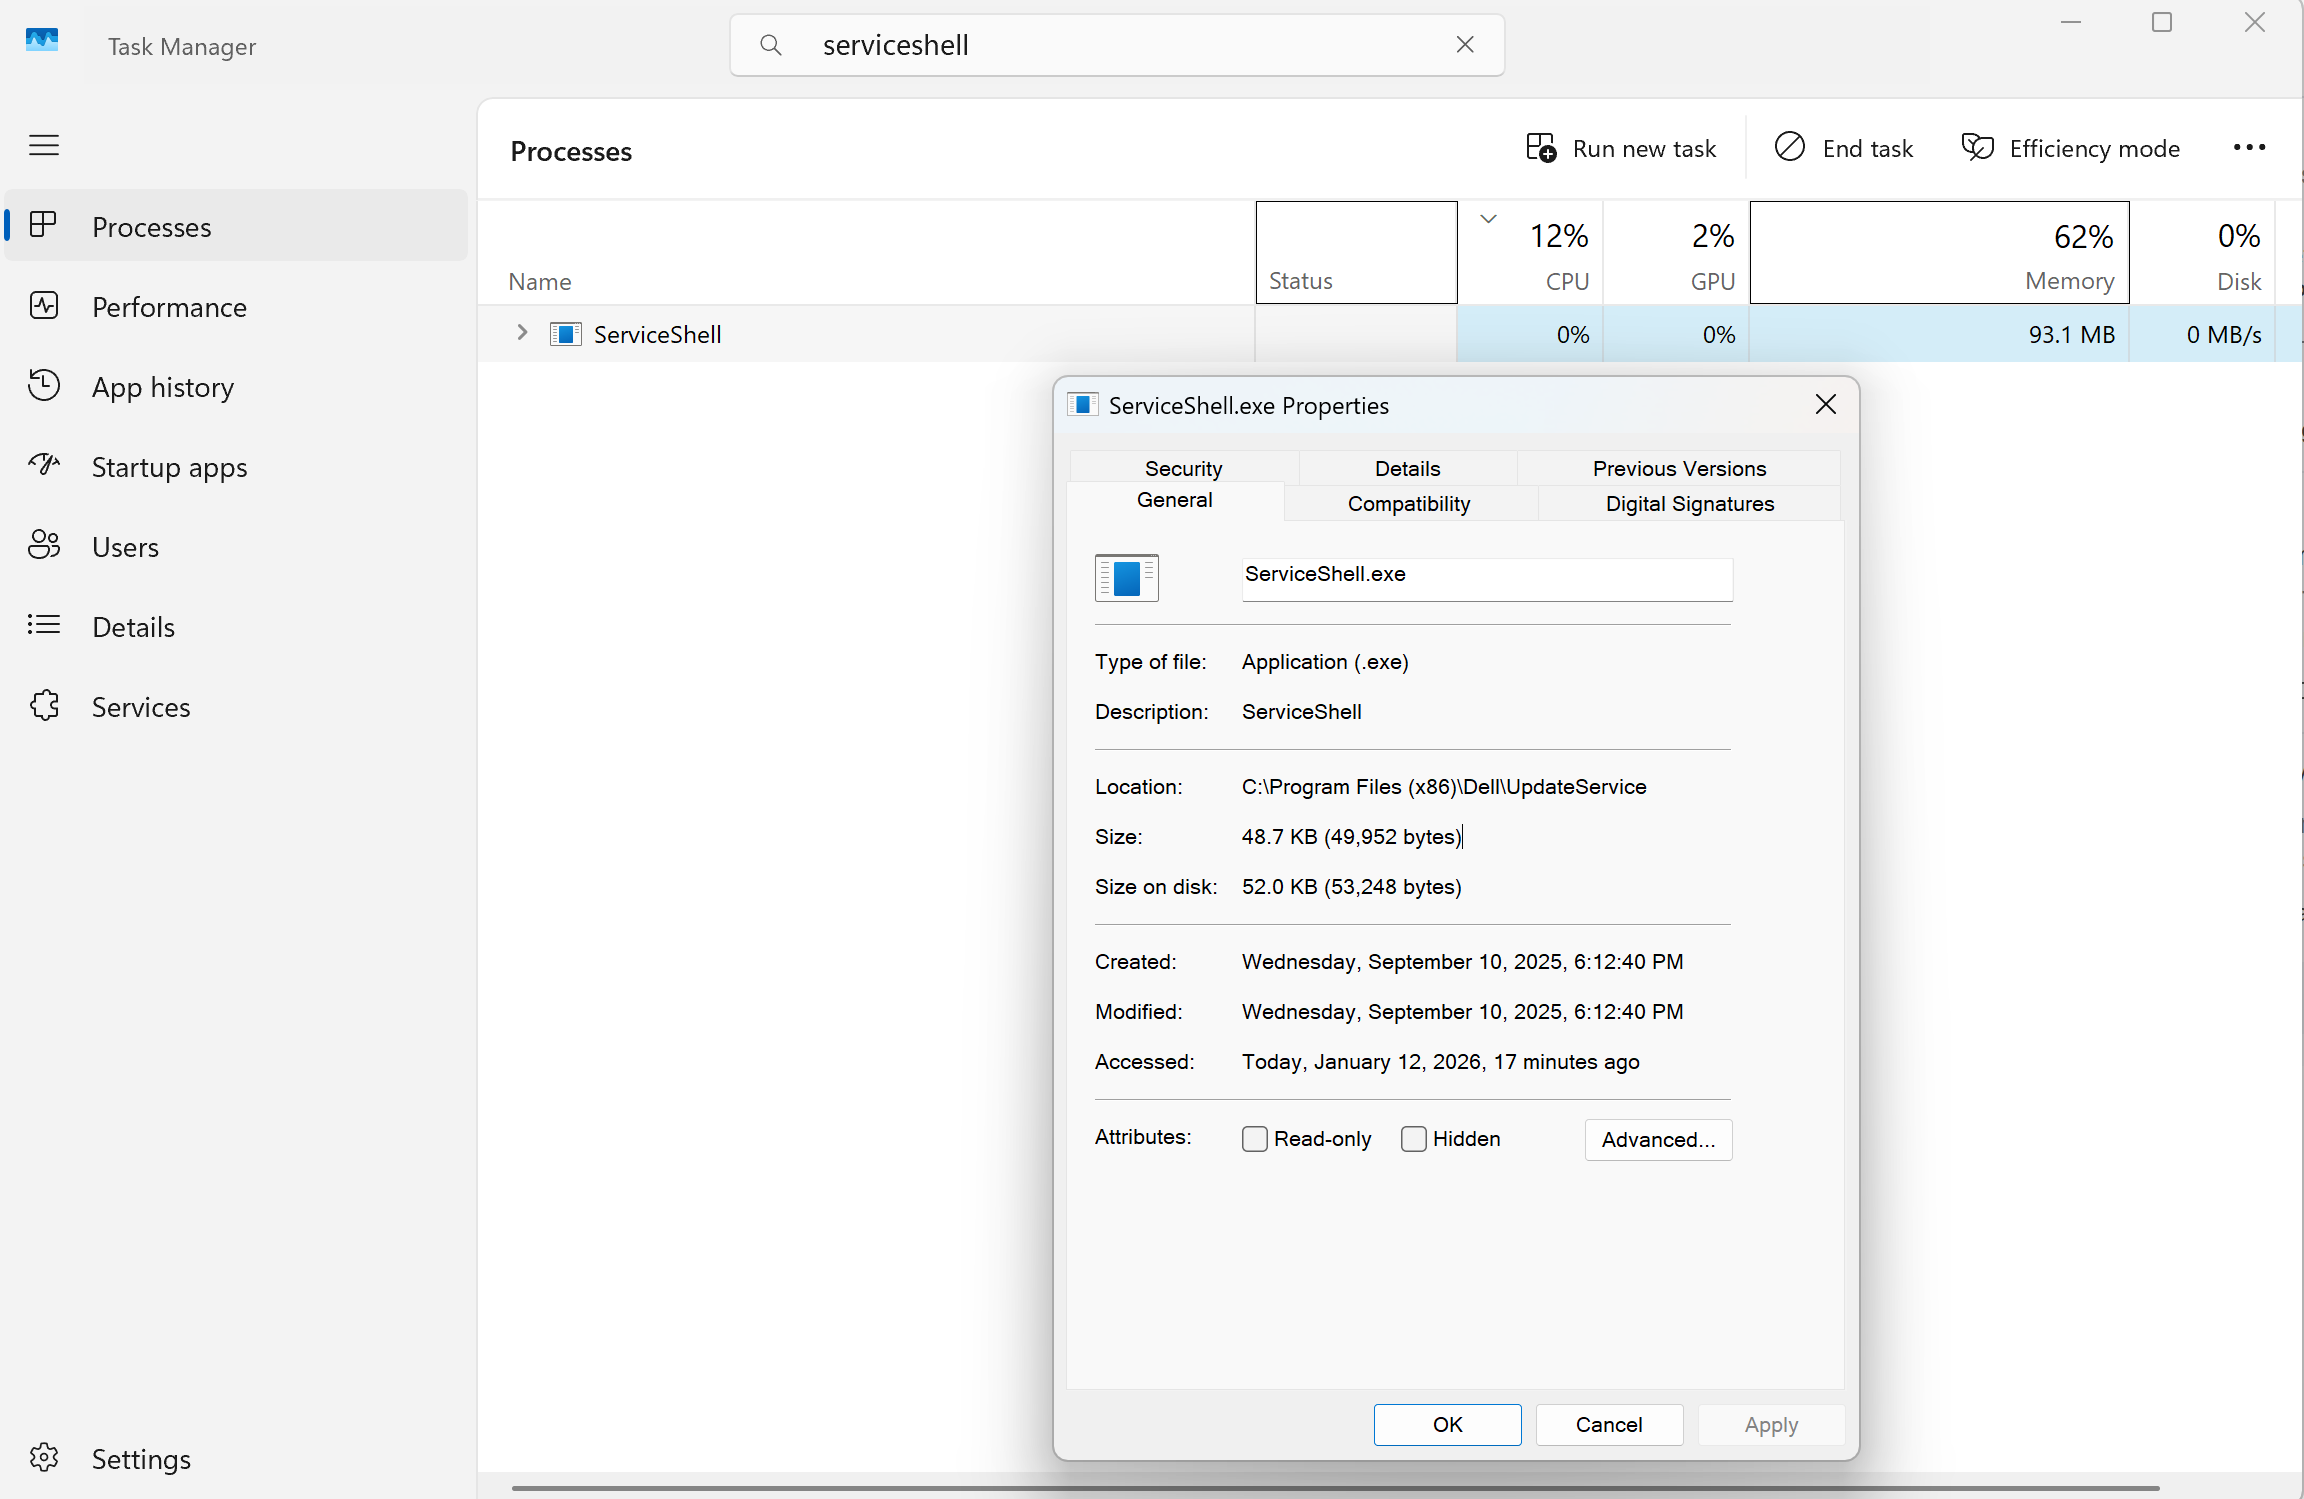
Note the memory usage here (93.1MB) is far less than the one we saw in Resource Manager, this again demonstrates that the value in Task Manager could be inaccurate in some cases.
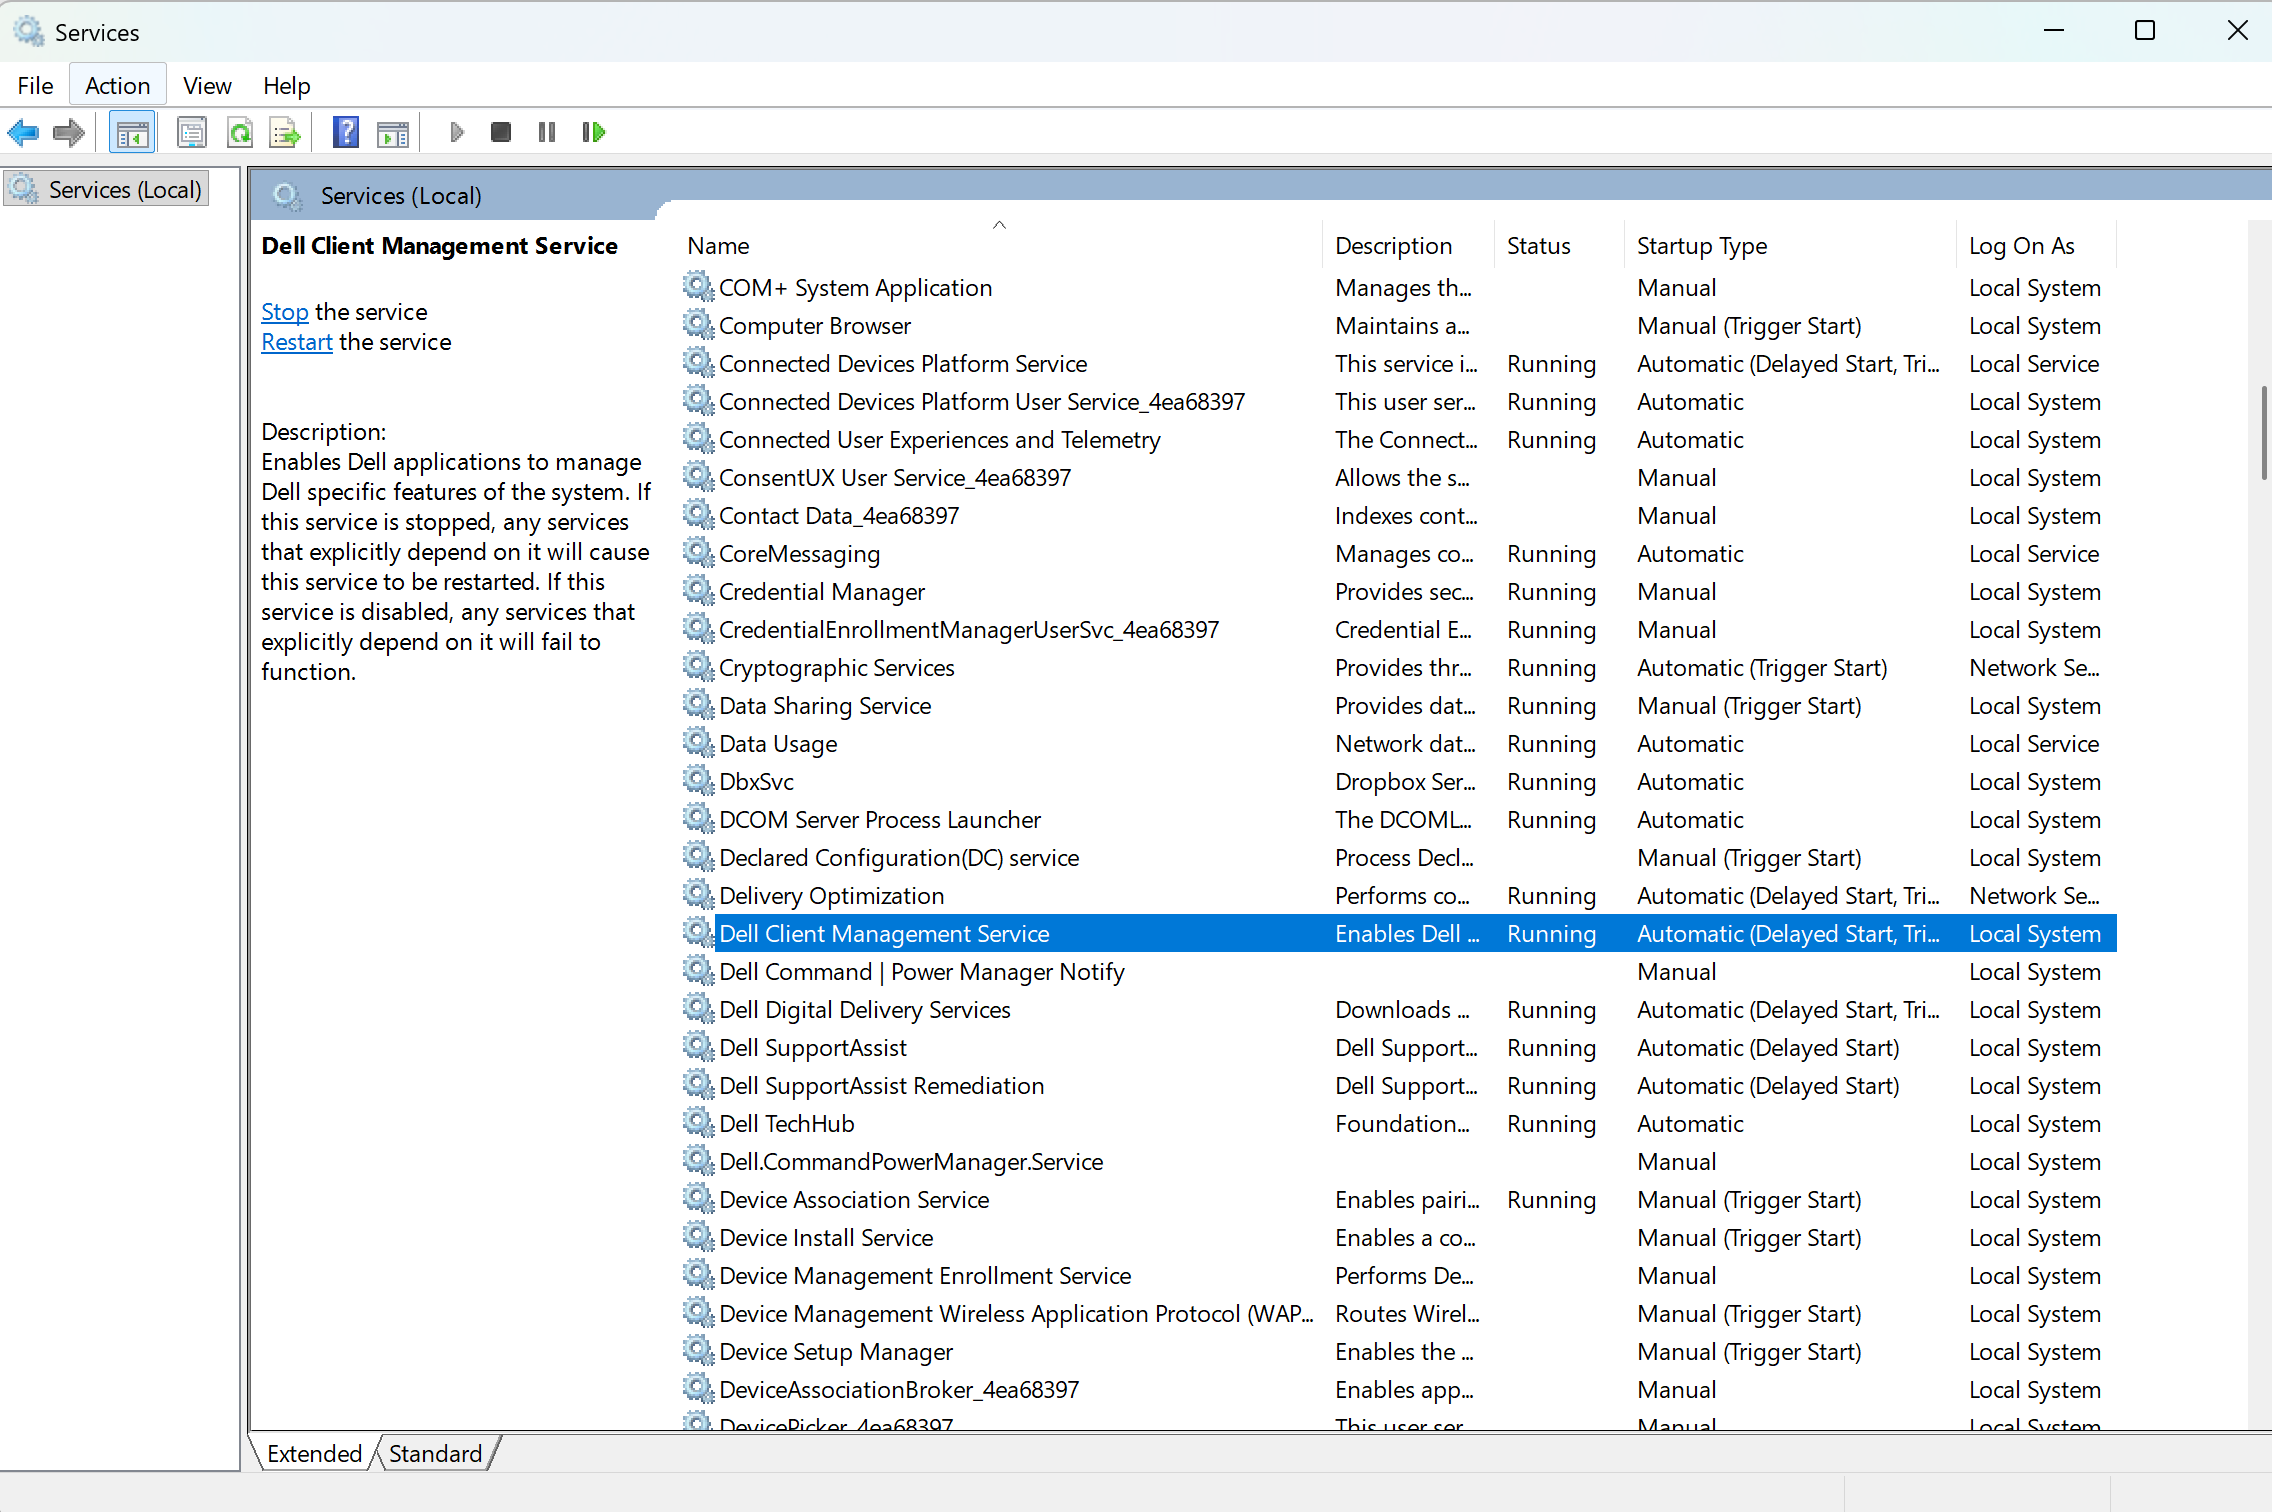
Also, by looking at the “Location” property, we know such process is part of Dell Update services.
Conclusion first, such memory leak problem is caused by Dell’s software, and disable the relevant service “Dell Client Management Service” could help: